American Gas Association
Transforming over 50 years of natural gas industry data from static reports into an interactive digital experience.
The American Gas Association (AGA) is one of the most influential trade organizations in the United States energy sector, a nationally recognized connector between natural gas utilities, regulators, policymakers, and the public.
Data is at the heart of their longstanding credibility. Rigorous, authoritative statistics covering consumption, storage, distribution, and revenue across the entire U.S. natural gas industry.
For decades, that data lived in a flagship publication called Gas Facts. It started as an annually printed compendium used by media, lawmakers, industry leaders, and regulators to shape energy policy and business strategy.
Comprehensive? Absolutely. Accessible? Not nearly enough.
AGA approached Mindgrub with a high-stakes and long-overdue challenge. It was finally time to transform their data ecosystem into the effective tool its users so desperately needed.
The Opportunity
AGA’s heaps of data were everywhere and therefore, effectively, nowhere.
Weekly, monthly, and annual reports existed across separate formats. Fourteen independent datasets lived exclusively on internal SQL servers. The Gas Facts compendium itself was published once a year, in hard copy, and required significant internal staff effort to produce and maintain.
If a senator’s policy team, a journalist on deadline, or a utility executive needed specific data, AGA staff would have to manually field and fulfill those requests. One by one.
AGA maintains some of the richest natural gas datasets in existence, some dating all the way back to 1947. The true challenge was that none of it was working hard enough. Static formats limited access and usability. Information silos made cross-dataset comparison nearly impossible. Manual updates introduced risk and slowed everything down. And non-technical audiences, the people who needed this information most, had no straightforward means to access it.
AGA needed a partner who understood the importance of regulated energy data and the art of simplifying access to it.
“Mindgrub helped us transform a complex, manually processed data ecosystem into a unified, dynamic platform, fundamentally improving how we deliver insights to our stakeholders.”
Taking Data From Raw To Readily Available
Mindgrub brought deep energy sector expertise and a user-first digital philosophy to the table from day one. Our approach centered on two core principles: no data left behind, and no user left confused.
We began with an intensive discovery and requirements definition process, working directly within AGA’s data architecture to understand every dataset, every schema, every nuance. For each of the 26 visualizations we ultimately built, we documented database schemas, filter logic, default views, units of measure, chart types, public-facing field labels, and table display logic.
Technical precision was not optional. This wasn’t a design project with a data layer bolted on. It was a data transformation project with world-class design built around it.
Mindgrub and AGA partnered to create a scalable, React.js-powered platform backed by a SQL database. Together, we created a set of 26 bespoke data visualizations, coupled with a backend that is ready to grow with AGA’s data for as long as they are collecting it.


“With Mindgrub's support, we moved from static reports to an interactive experience that brings our insights to life. Mindgrub was a true partner throughout this process, taking the time to understand our challenges and deliver a solution that exceeded expectations.”
The Transformation
-
406 datasets
-
42 database tables
-
26 interactive visualizations
-
50 years of data, now searchable
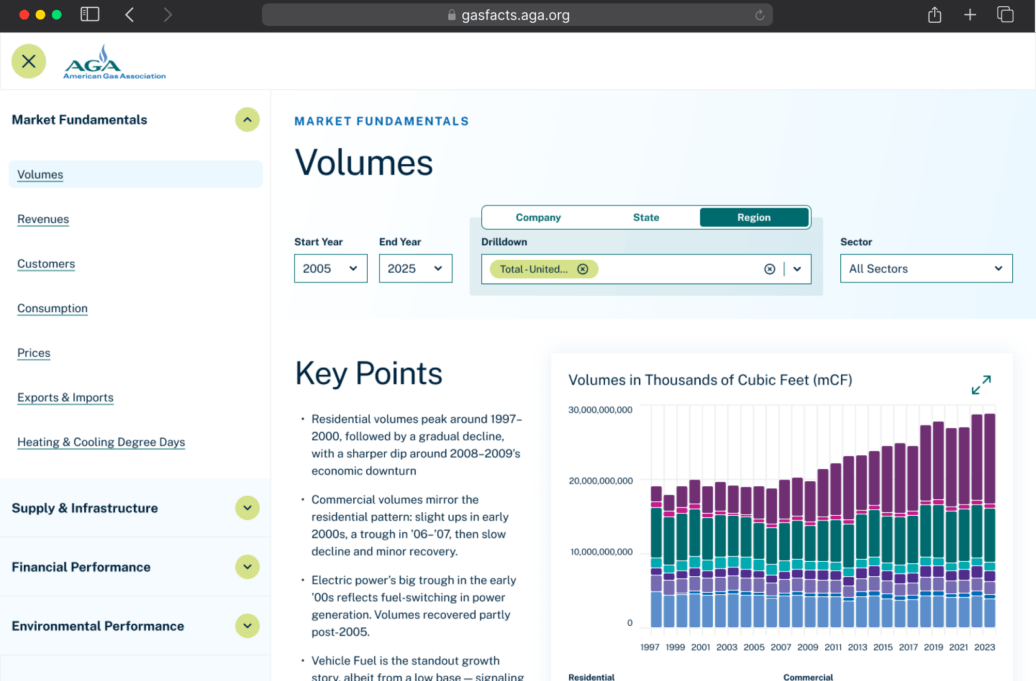
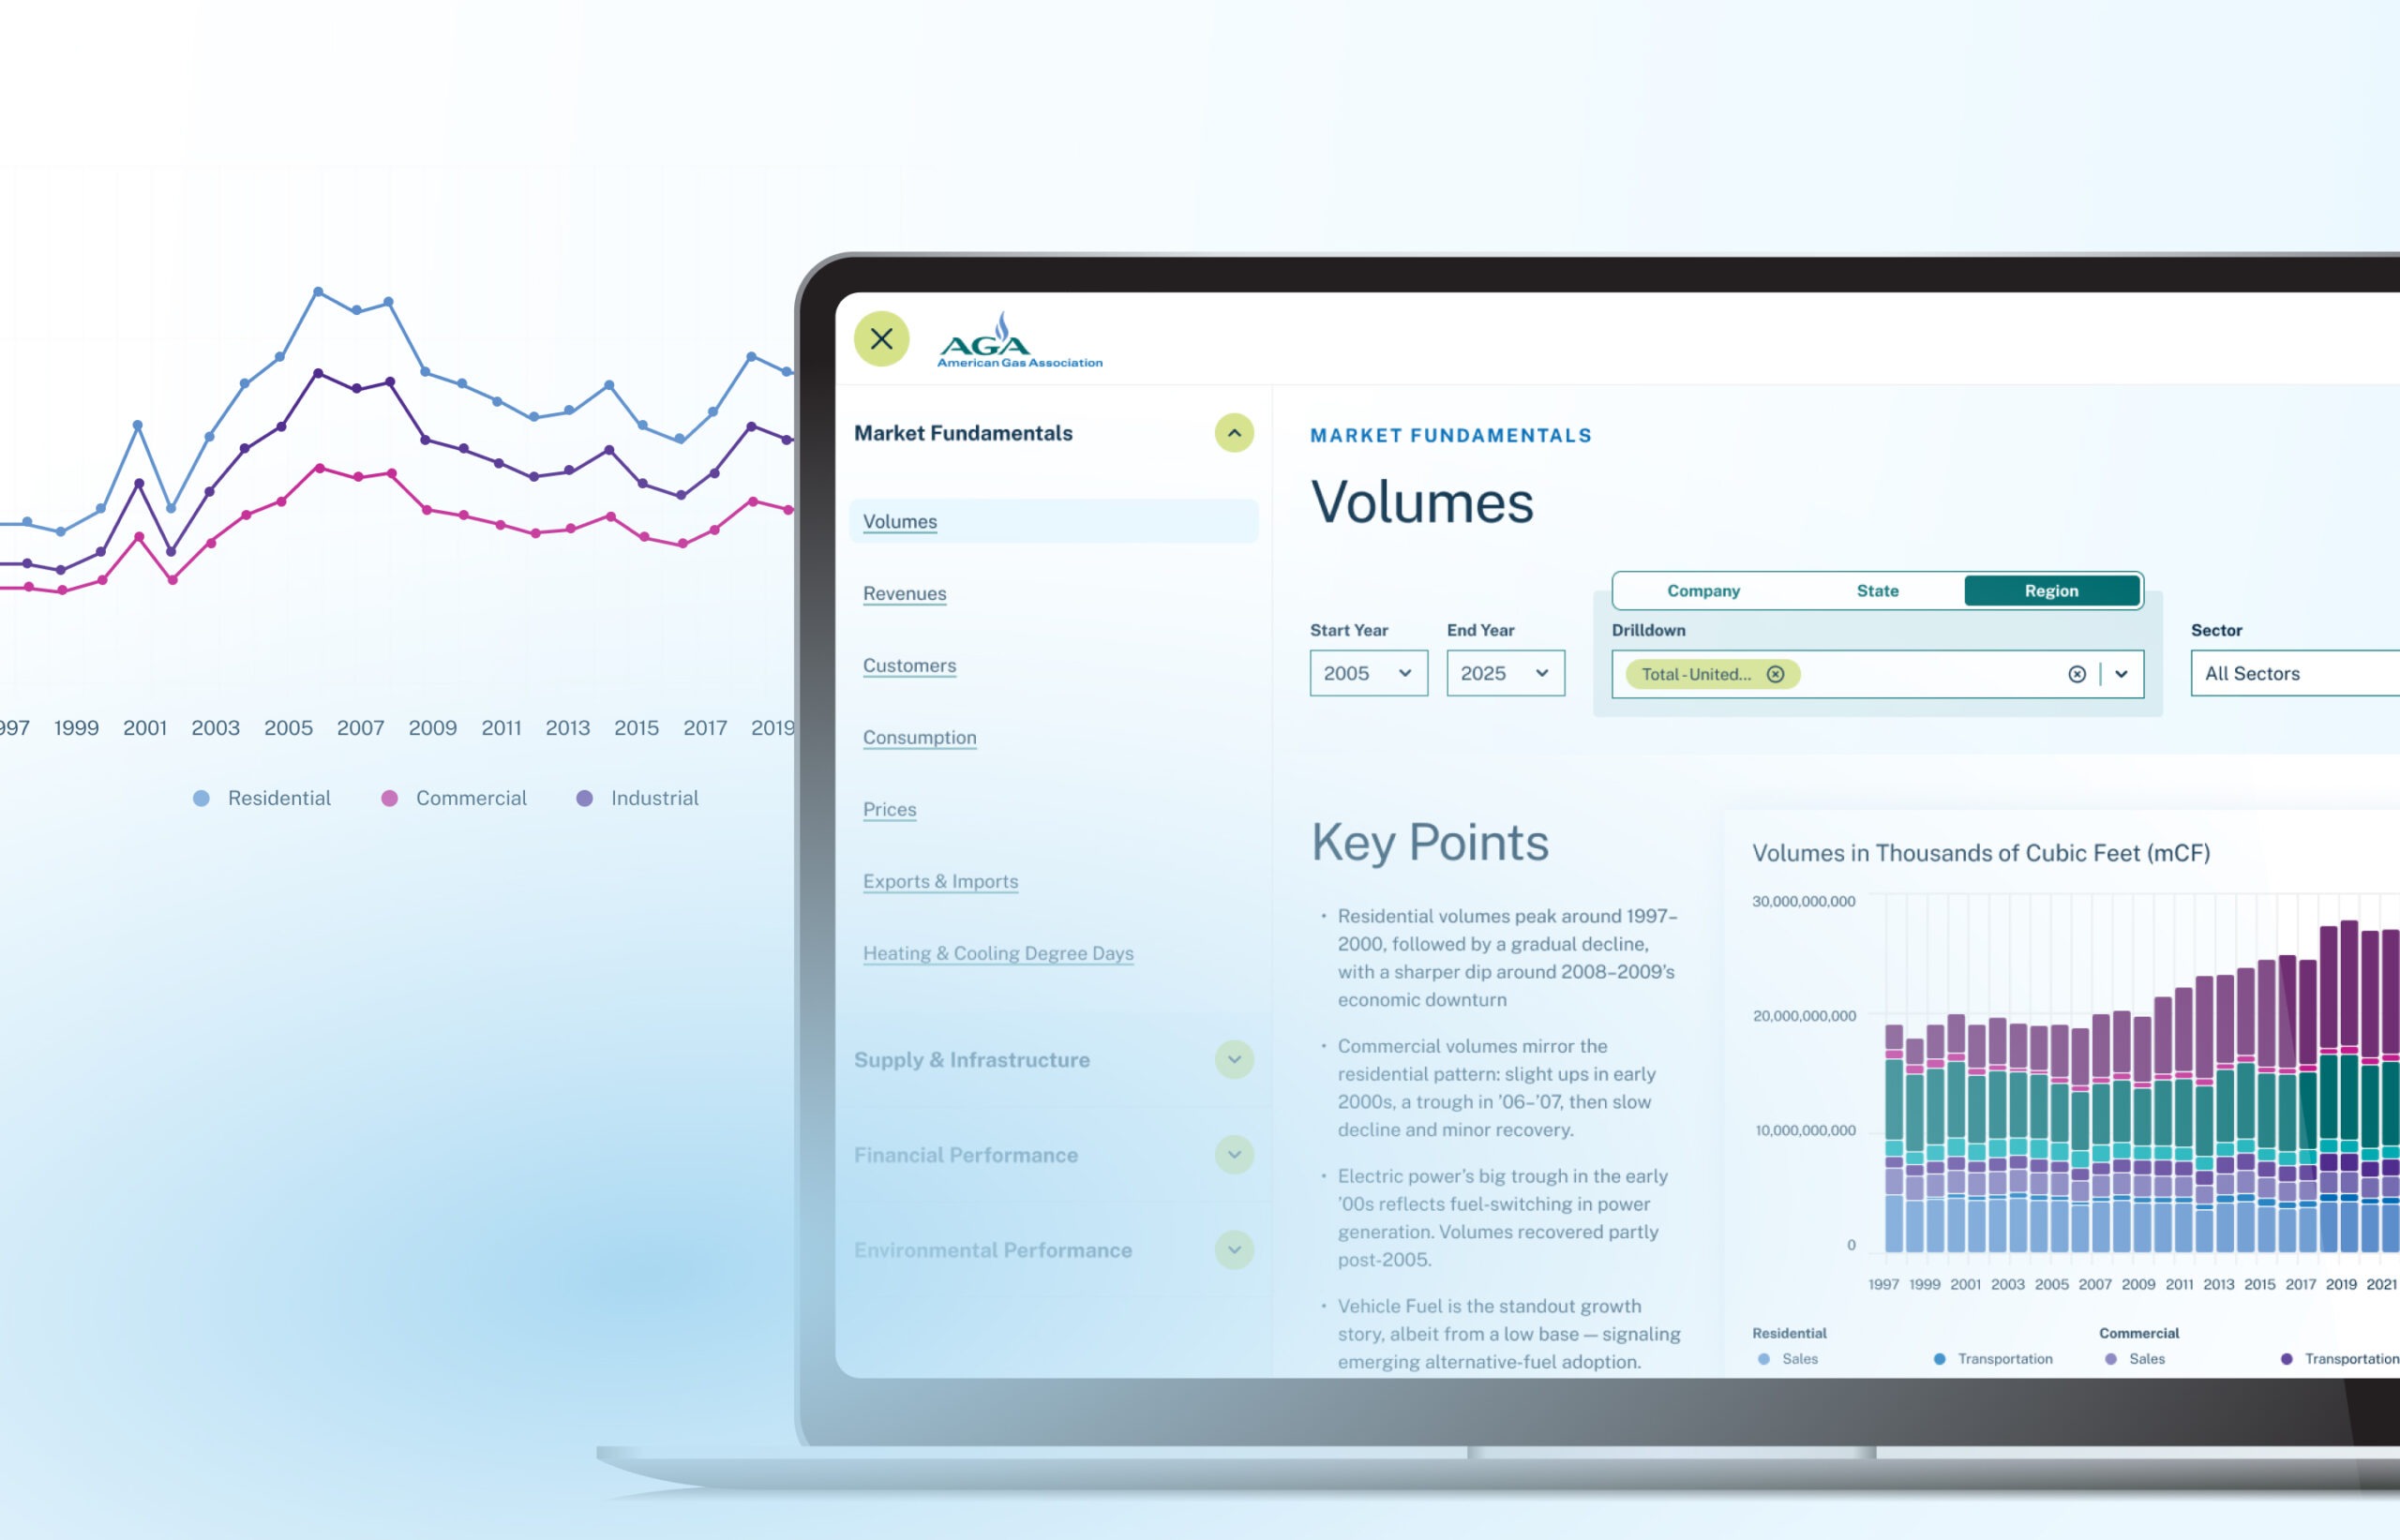
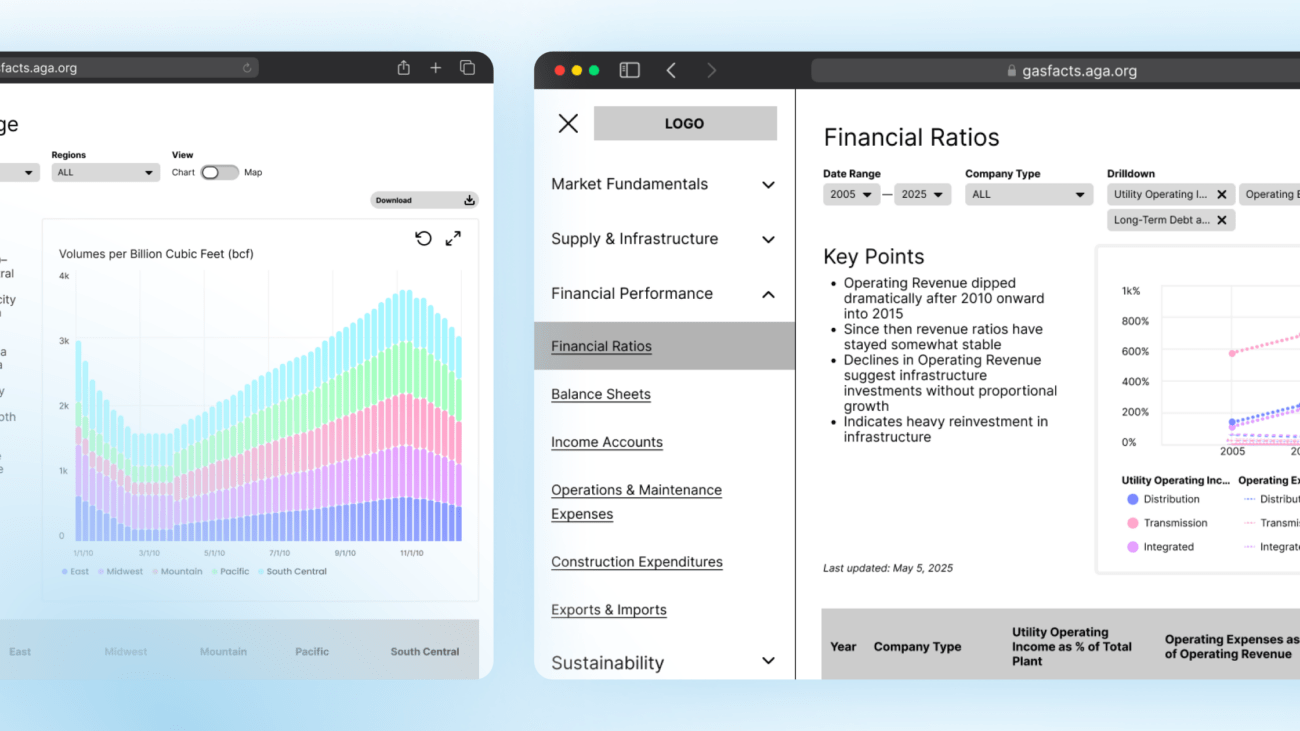
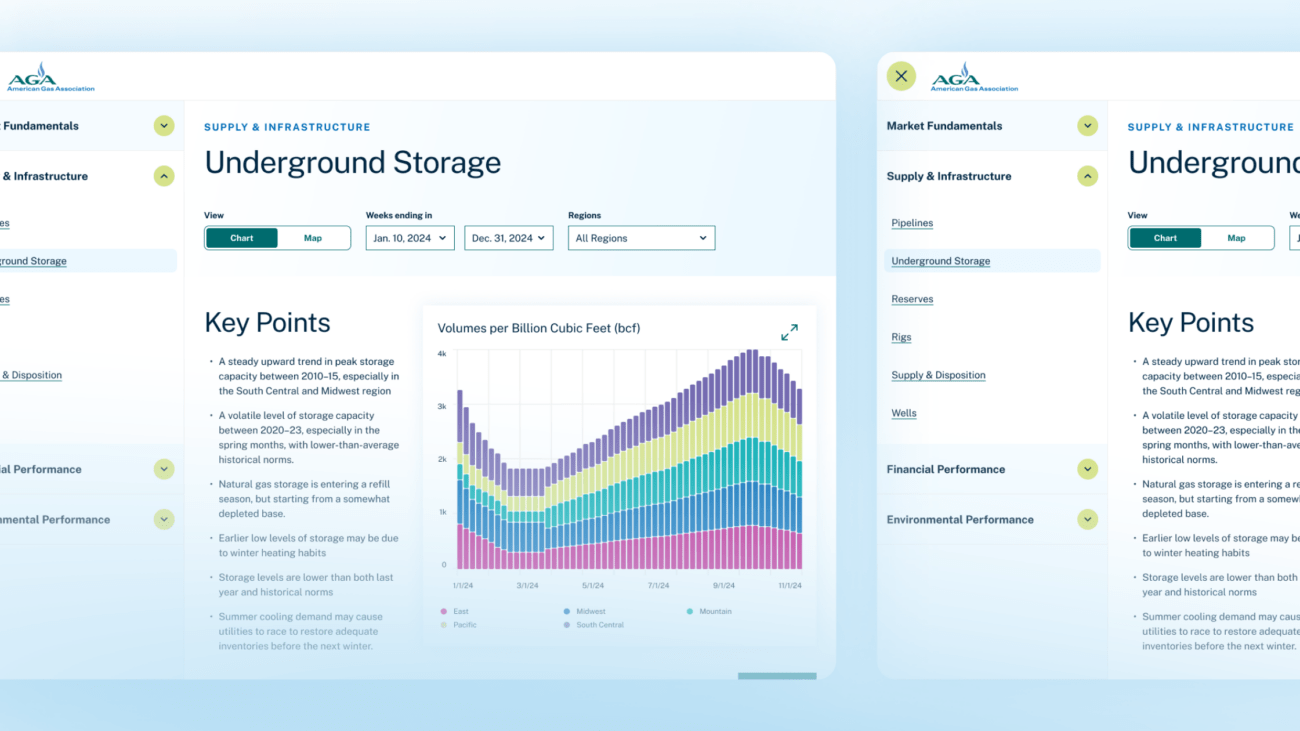
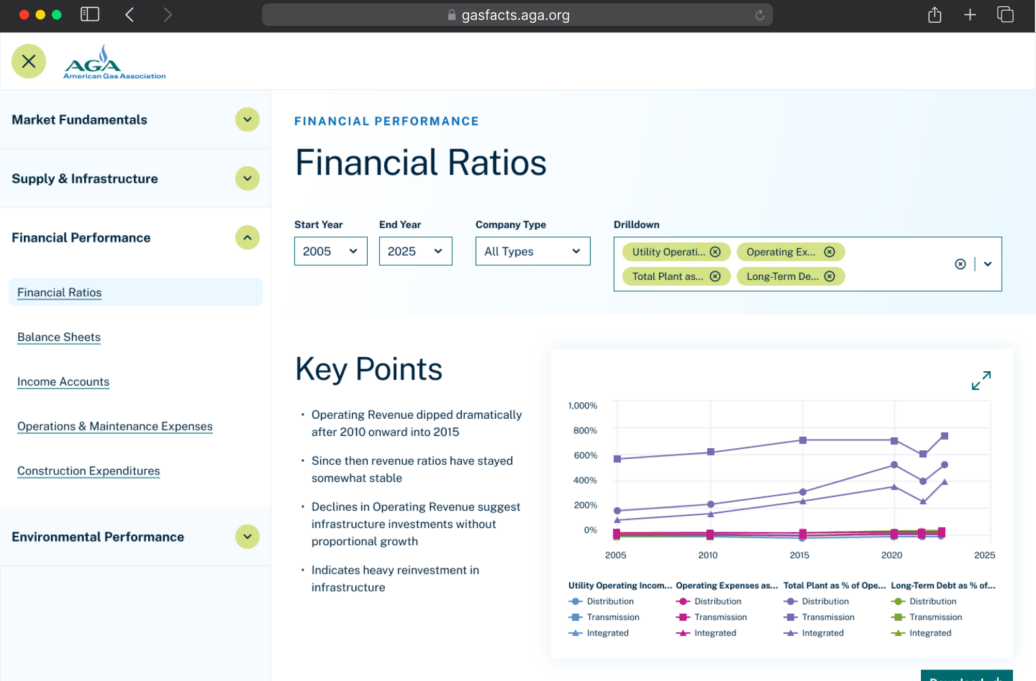
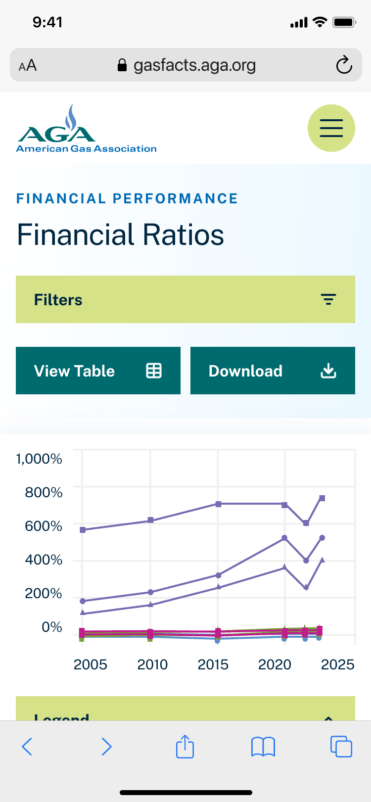
We consolidated AGA’s sprawling data ecosystem and engineered each visualization to pull live from the backend, responding dynamically to user inputs. Users can compare and explore seemingly endless data in real time on their own, saving the AGA team endless hours.
Every visualization features intuitive filtering across geographies, timeframes, volumes, revenues, and dozens of other variables. The decades-long view is what separates AGA’s Gas Facts tool from any generic data dashboard. It’s a living archive and a real-time resource at the same time.
The platform’s architecture was also built with the future in mind. AGA can add new datasets and spin up new visualizations quickly and independently, meaning as the natural gas industry grows and changes, so does the tool.